
The contemporary corporate landscape is saturated with information, yet the efficacy of data-driven decision-making remains remarkably low in many sectors. While organizations have invested heavily in business intelligence (BI) tools and data engineering, a significant disconnect persists between the generation of numbers and the execution of strategy. This phenomenon, characterized by dashboards that are technically accurate but "communicatively inert," has prompted a shift toward integrating structured User Experience (UX) thinking into the realm of data visualization. As industry experts like Meriem Benhabiles have observed, the failure of a dashboard to produce a decision is rarely a failure of the data itself; rather, it is a failure of design to bridge the gap between raw metrics and human cognition.
The Crisis of Data Saturation and the Visualization Gap
In the current digital economy, data is more accessible than ever before. Functions ranging from sales and product development to marketing and operations are supported by a continuous stream of performance decks and real-time dashboards. However, the ubiquity of these tools has led to a recurring organizational failure: meetings where data is presented, acknowledged, and subsequently ignored. When a dashboard fails to trigger a clear direction, the instinctual response is often to blame the data’s granularity or completeness. Yet, industry analysis suggests that the problem lies in the "data-first" approach, where charts are built based on available datasets rather than the specific questions requiring answers.
Data visualization and UX design are increasingly viewed as complementary disciplines solving the same fundamental problem: the movement of critical information to the right person in a way that facilitates change. By treating dashboards as functional tools rather than passive reports, organizations can move beyond "noise" and toward actionable insights. This evolution is necessary as the volume of global data continues to grow exponentially, with the International Data Corporation (IDC) predicting that the Global DataSphere will exceed 175 zettabytes by 2025. Without a UX-driven approach, this volume of information risks becoming a liability rather than an asset.
Historical Context: From Raw Statistics to Visual Truth
The necessity of visualization was famously demonstrated in 1973 by the statistician Francis Anscombe. In his seminal paper, he presented "Anscombe’s Quartet"—four datasets that are statistically identical in terms of mean, variance, correlation coefficient, and regression line. Despite these identical summary statistics, the visual plots of the data reveal four radically different patterns: one linear, one curved, one with a single outlier, and one where the data is clustered with a vertical outlier.
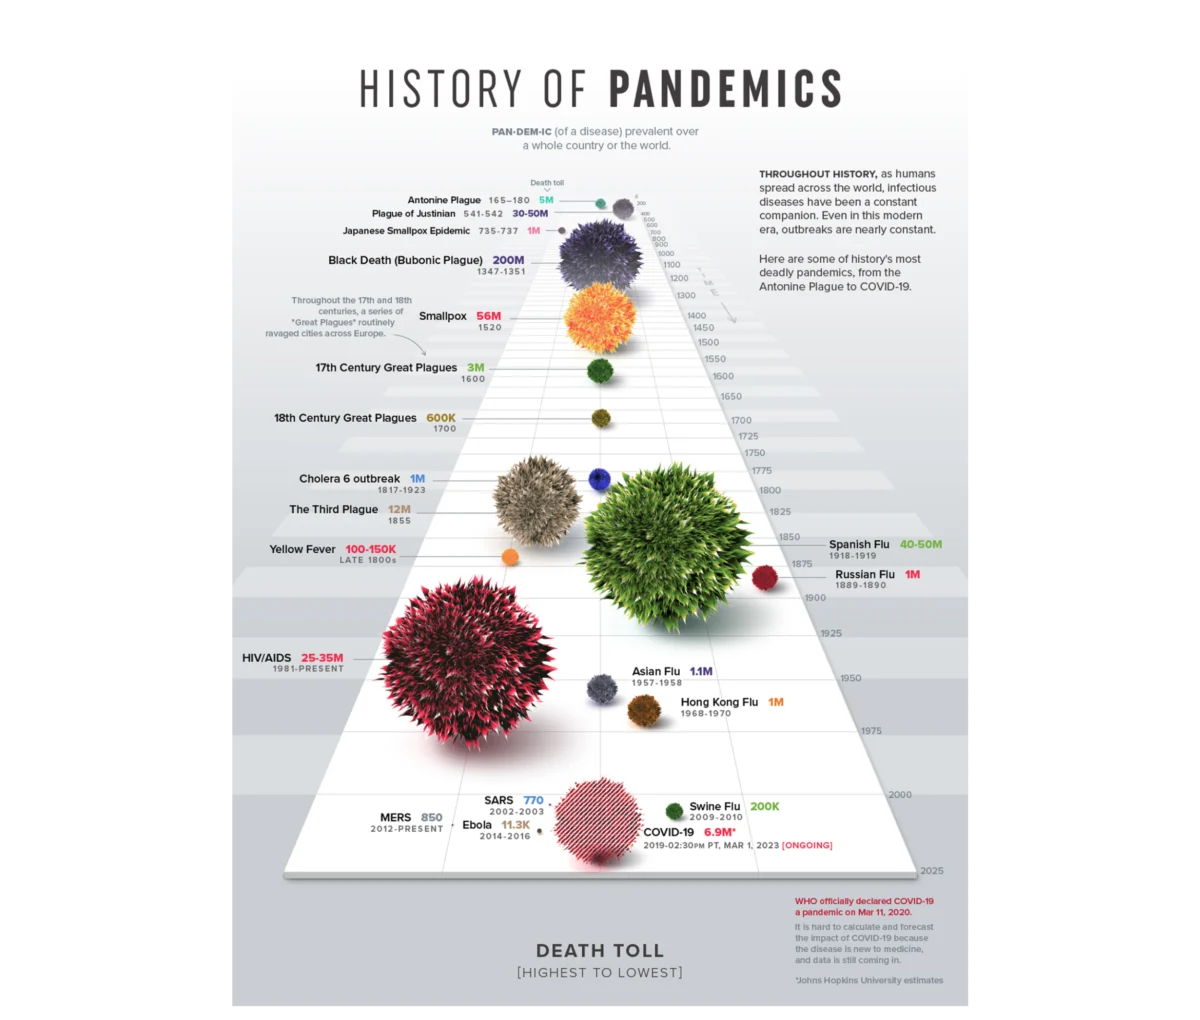
Anscombe’s lesson remains a cornerstone of data science: visualization reveals the operational truth that raw numbers conceal. However, modern data UX goes a step further, arguing that visualization must be communicative, not just diagnostic. A notable example is Visual Capitalist’s "History of Pandemics," which utilizes a proportional bubble layout on a single timeline. This design allows the human brain to grasp the staggering scale of the Black Death relative to other historical events before a single label is processed. This immediate cognitive "unlock" is the hallmark of effective data UX, where the form of the data makes the story impossible to miss.
The 80/20 Rule of Data UX Architecture
A core principle emerging in the field is that approximately 80% of the work determining a dashboard’s success occurs before a single chart is drawn. This upstream work is centered on three critical pillars: context, audience, and insight.
Pillar 1: Establishing Context Over Availability
Most data projects suffer from "anchoring bias," where teams build visualizations around whatever metrics their current tools already track. A context-first approach reverses this. Instead of a vague goal like "monitoring product performance," a UX-driven goal might be "identifying which features drive retention among users who signed up in Q1." This specificity introduces a metric, a defined population, and an implied action. By filtering out the noise—often as much as 90% of available data—teams can create high-impact funnels that pinpoint bottlenecks, such as a specific drop-off point in an e-commerce checkout flow.

Pillar 2: Audience Familiarity and Accountability
Designing for an audience requires a deep understanding of data literacy and professional responsibility. A Head of Sales and a Senior Data Analyst may look at the same dataset but require entirely different interfaces.
- Familiarity: Does the user read charts instinctively, or do complex visuals create friction?
- Accountability: How much weight does the user carry for the numbers shown? An executive responsible for a 12% revenue decline processes that information with more cognitive pressure than a reporting analyst.
Adjusting the "density dial" is essential. Analysts require high-density environments for diagnostic discovery, allowing them to interrogate data at an atomic level. Conversely, executives require synthesized overviews optimized for rapid budget and strategy decisions.
Pillar 3: Defining the Desired Insight
Information is what the data shows; insight is what the user does with it. If the intended business change is not defined prior to design, the dashboard defaults to passive reporting. For example, a standard dashboard might show a 15% drop in booking rates, causing a "fire drill" in the engineering department. A dashboard built for insight, however, would map that drop against traffic sources, potentially revealing that the decline is actually a dilution caused by a low-intent marketing campaign, thereby saving the engineering team from unnecessary work.
Case Study: Enterprise Talent Management and Competency Tracking
The practical application of these principles was recently evidenced in a project for a B2B SaaS platform specializing in enterprise talent management. The platform held a massive archive of user activity telemetry but lacked a coherent way to present it to enterprise teams.

Strategic Implementation
The design team moved beyond the initial brief of "presenting user activity" and instead focused on the mechanics of performance. They identified that "time spent" on the platform was merely a proxy for engagement, not a metric of success. The more meaningful signals were competency scores, certification rates, and historical performance trajectories.
Addressing the Audience Rift
The project utilized two distinct narrative structures:
- Individual Contributors: For employees, the dashboard acted as a "self-directed mirror." It focused on personal pacing, strengths, and slipping metrics to help them prioritize their weekly tasks.
- Team Managers: For leadership, the interface bypassed individual milestones to provide a macro "pulse check" on team vulnerabilities. This allowed managers to intervene before skill gaps evolved into project failures.
The Innovation of the Radar Chart
A pivotal design choice was the use of radar charts (also known as spider charts) to map multi-dimensional skills. While a linear bar chart would require a user to scan eight individual bars to calculate variance, a radar chart connects those points into a single, unified shape. A balanced polygon signals a well-rounded skill set, while a skewed shape immediately draws the eye to a critical vulnerability. This geometric approach to data allows for an "at-a-glance" understanding of complex human variables.
Broader Impact and Industry Implications
The shift toward UX-driven data visualization has measurable impacts on organizational health. In the talent management case study, the deployment of personalized dashboards led to a noticeable increase in weekly active engagement with analytics features. Managers shifted from monthly static reporting to proactive weekly planning. Furthermore, the client reported that platform churn fell to one of its lowest points on record, as users found more tangible value in the insights provided.

According to a study by Gartner, through 2025, data stories will be the most widespread way of consuming analytics, and 75% of these stories will be automatically generated using augmented analytics techniques. However, the human element of "Design Thinking" remains the critical differentiator. Automated tools can plot numbers, but they cannot yet understand the nuances of organizational accountability or the specific pressures of a unique business context.
Conclusion: The Future of Data as a Message
The evolution of data visualization from a downstream formatting step to an upstream architectural choice marks a turning point in the Information Age. When dashboards are treated as decision-making engines, they cease to be passive logs of the past and become active drivers of the future.
To achieve this, designers and analysts must adhere to the following framework:
- Context: Start with the question, not the database.
- Audience: Calibrate the density of information to the user’s literacy and pressure.
- Insight: Ensure every chart implies a clear next step or decision.
As organizations continue to grapple with the complexities of the digital transformation, the ability to translate "technical correctness" into "communicative power" will be the primary factor that determines which companies can act with agility and which will remain buried under the weight of their own data. Professional data design is no longer a luxury; it is a fundamental requirement for functional, data-driven leadership.

