
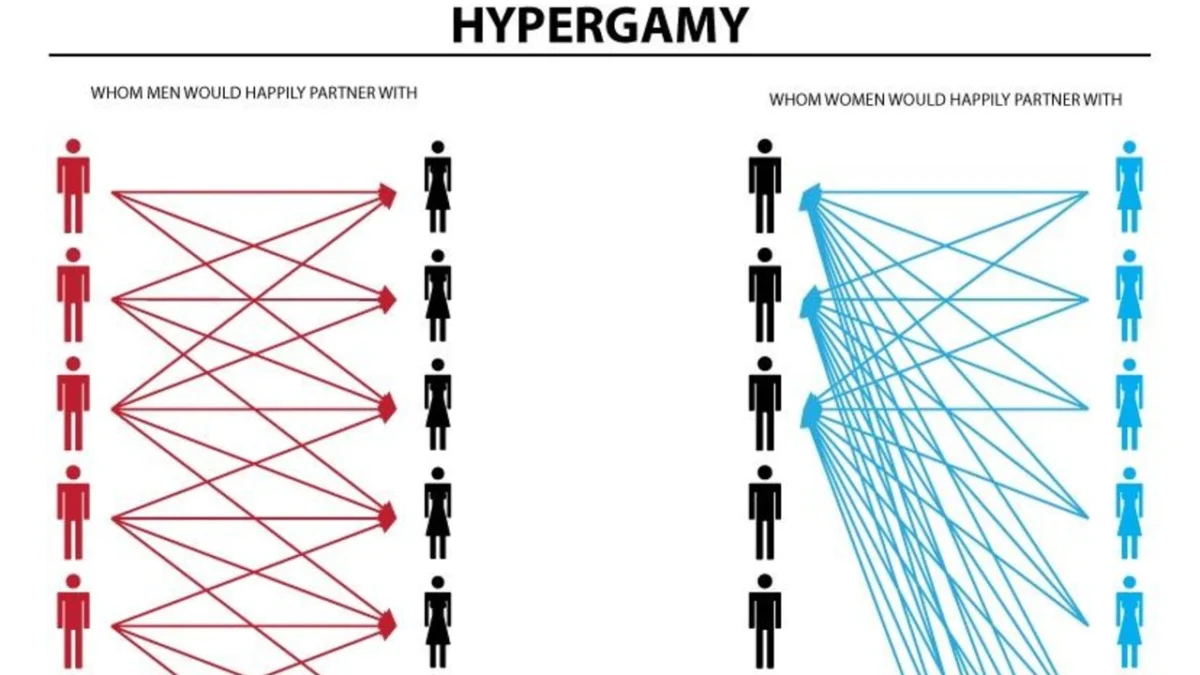
The digital landscape of the late 2010s and mid-2020s has been marked by the rise of complex, often controversial, visual aids designed to distill socio-biological theories into digestible social media content. Among the most enduring and polarizing of these artifacts is the Hypergamy Chart. Originally conceived as a didactic tool within niche online forums to illustrate the concept of "dating up," the chart has evolved into a widespread exploitable meme format. Its journey from the depths of the "manosphere"—a collection of digital subcultures focused on masculinity, often including incel and looksmaxxing communities—to mainstream platforms like TikTok and Instagram reveals a significant shift in how modern audiences engage with evolutionary psychology and gender dynamics.
The Hypergamy Chart typically features a dual-graph comparison. On one side, it depicts a "wide range" for men, suggesting that males are willing to date and find attraction across a broad spectrum of social, economic, and educational statuses. On the opposing side, it illustrates a "narrow range" for women, claiming that female attraction is strictly reserved for the top tier of men—those possessing the highest levels of status, wealth, and physical appeal. This visual representation is intended to validate the theory of hypergamy: the sociological premise that individuals, particularly women, seek partners of higher status than themselves.
Theoretical Foundations and Sociological Context
To understand the impact of the Hypergamy Chart, one must first examine the academic roots of the term it seeks to represent. In classical anthropology and sociology, hypergamy is defined as a structural practice where an individual marries a spouse of a higher social caste or socioeconomic class. Historically, this was a primary vehicle for social mobility in rigid class systems.
However, the modern digital interpretation of hypergamy, as popularized by the chart, draws more heavily from evolutionary psychology and sexual economics. It suggests a biological imperative rather than a mere social strategy. Critics and scholars note that while formal structural hypergamy has declined in many developed nations due to increased female educational attainment—leading to a rise in "assortative mating" or marrying within one’s own class—the online discourse has pivoted toward "mate value" trade-offs. This includes the exchange of youth and physical attractiveness for financial security and social standing, a concept explored by Nobel laureate Gary Becker in his economic models of marriage. The Hypergamy Chart serves as a simplified, often hyperbolic, visual shorthand for these complex social exchange theories.
Chronology of the Meme: From Niche Forums to Viral Status
The digital life of the Hypergamy Chart began on November 19, 2018. A Reddit user operating under the handle FactCheckOnTheFly posted the original iteration to the subreddit /r/WhereAreAllTheGoodMen. The post, titled "A visual aid for the lurkers, newbies, and other uninitiated men," was framed as a cautionary guide. The creator argued that the chart on the left reflected long-term mating strategies, while the one on the right illustrated short-term "fucking" strategies, concluding with the provocative claim: "If you are not in the top tier, you are literally invisible to women."
While the initial Reddit post garnered a modest 150 upvotes over several years, its influence far outpaced its immediate engagement metrics. By the early 2020s, the chart began to circulate within "incel" (involuntary celibate) and "looksmaxxing" (the practice of attempting to maximize one’s physical appearance) communities. In these spaces, the chart was used both as a tool for self-improvement—urging men to climb the status ladder—and as a vehicle for criticizing what they perceived as the inherent shallowness of modern dating.
The transition of the Hypergamy Chart from a serious "manosphere" infographic to an "exploitable" meme format began in earnest around 2024. On January 21, 2024, the subreddit /r/redscarepod saw a parody version that replaced human status indicators with characters from the Alvin and the Chipmunks franchise. This marked a turning point where the chart’s rigid logic was met with internet irony. By early 2025, this "Chipmunk Hypergamy" variant migrated to /r/PeterExplainsTheJoke, signaling its entry into the broader cultural consciousness.
The 2026 Viral Surge and Platform Expansion
The most significant explosion of the Hypergamy Chart occurred in 2026, driven largely by short-form video algorithms on TikTok and Instagram. During this period, the meme format shifted from the chart itself to "reaction" content. These videos typically featured a character—human, animal, or animated—experiencing a profound emotional breakdown upon "learning the truth" about hypergamy.
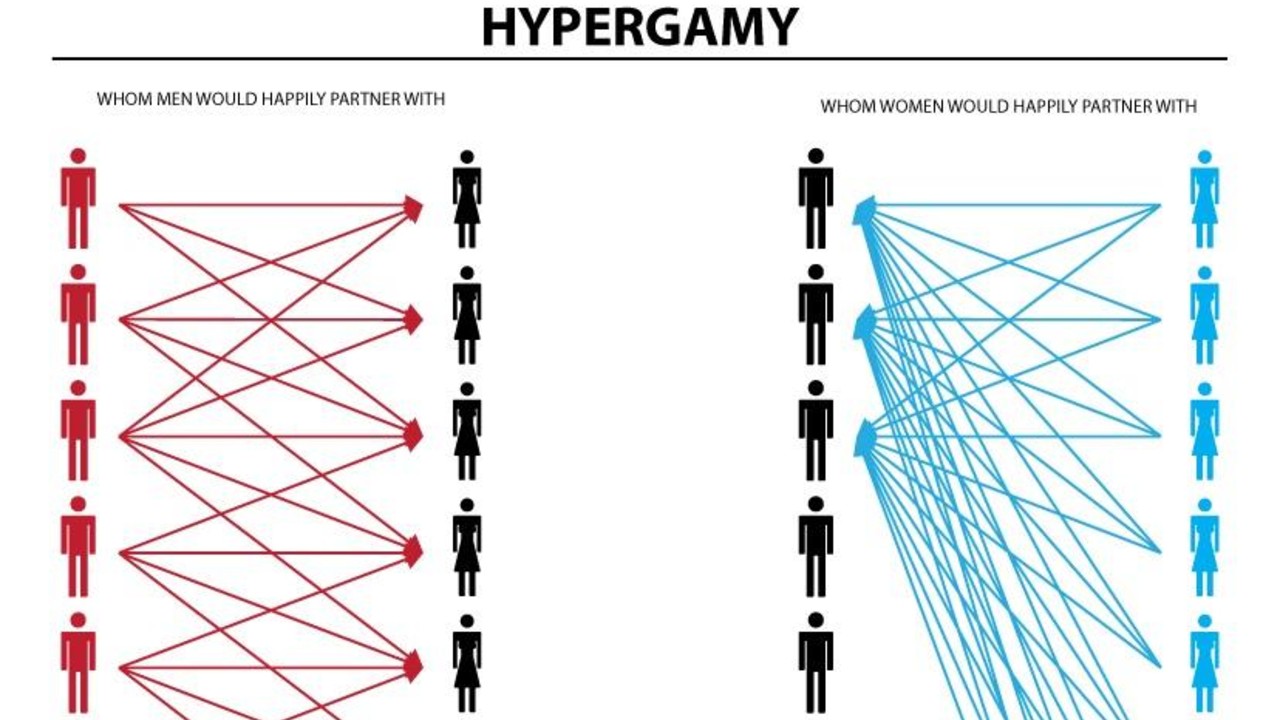
On May 30, 2026, a TikTok creator known as @visserpill posted a video featuring a dog appearing devastated while the Hypergamy Chart faded into view. The video struck a chord with the platform’s demographic, garnering over 2.5 million views in less than six months. The use of "sad" or "distressed" animals served to mock the gravity with which some communities viewed the chart, while simultaneously introducing the concept to millions of uninitiated viewers.
The trend continued through the autumn of 2026. On September 21, the Instagram page "lookssmxr" posted a highly detailed version of the chart that assigned specific facial archetypes and social "types" to the status tiers. This post received 111,000 likes in a single month, demonstrating a continued appetite for the "black pill" (a term for fatalistic nihilism regarding dating) aesthetics. Subsequent viral hits included a TikTok by @alestro_here on September 28, 2026, which featured a frog seemingly leaping off a cliff after encountering the chart, and an October 14 video by @lightskin.gio showing a man spotting the chart’s silhouette in the clouds, as if it were an inescapable law of nature.
Analysis of Implications and Community Reactions
The proliferation of the Hypergamy Chart has sparked a wide range of reactions from sociologists, digital culture experts, and the general public. For many in the "manosphere," the chart is viewed as a "red pill"—a revelation of the harsh realities of the "sexual marketplace." They argue that the chart accurately reflects the lopsided nature of modern dating apps, where data from platforms like Tinder often suggests that a small percentage of men receive the majority of female attention.
Conversely, social scientists and feminist critics argue that the chart is a gross oversimplification that ignores the multi-dimensional nature of human attraction. They point out that factors such as personality, shared interests, proximity, and emotional intelligence are entirely absent from the graph. Furthermore, researchers note that the "hypergamy" described in these memes often relies on outdated gender roles that do not account for the increasing financial independence of women in the 21st century.
From a digital marketing and algorithmic perspective, the success of the Hypergamy Chart meme highlights the power of "rage-bait" and controversial content. The chart is inherently divisive, ensuring high engagement through heated debates in the comments sections. Platforms like TikTok, which prioritize watch time and interaction, naturally amplify such content, leading to a "filter bubble" effect where users are repeatedly exposed to increasingly radicalized versions of these dating theories.
Broader Impact on Modern Dating Discourse
The legacy of the Hypergamy Chart extends beyond its life as a meme. It has become a symbol of the "quantification" of dating. In an era dominated by swipes and data-driven matching, the chart offers a pseudo-scientific framework for individuals to rationalize their romantic successes and failures. For some, it provides a roadmap for "self-optimization"; for others, it serves as a justification for resentment.
The chart’s evolution also reflects a broader trend in internet culture: the "meme-ification" of trauma and social anxiety. By pairing a chart that suggests most men are "invisible" with videos of crying cats or suicidal frogs, the internet has created a language of "ironic despair." This allows users to engage with genuine anxieties about loneliness and status while maintaining a layer of protective irony.
As of late 2026, the Hypergamy Chart remains a staple of digital discourse. Whether viewed as a legitimate sociological insight, a harmful piece of misinformation, or a harmless exploitable joke, its persistence underscores the deep-seated tensions in contemporary gender relations. As long as the complexities of human attraction remain a source of mystery and frustration, visual aids like the Hypergamy Chart will likely continue to find a receptive audience in the ever-evolving theater of social media.

