

Google Search Console stands as an indispensable tool for any entity aiming to gauge and enhance its organic search visibility. However, for busy executives who may not possess deep Search Engine Optimization (SEO) expertise, the Performance reports within this platform can often present a complex landscape. A frequently encountered and sometimes bewildering metric is "Average position." This article aims to demystify this crucial data point, offering clarity and actionable insights for a more strategic understanding of website performance in Google’s search engine results pages (SERPs).
The Nuances of "Average Position" in Google Search Console
The "Average position" metric within Google Search Console’s Performance reports is designed to provide a snapshot of how a website ranks for specific search queries. However, its interpretation is often clouded by the aggregation of data and the dynamic nature of Google’s search results. Understanding the different ways this metric is presented and what it truly signifies is paramount for effective SEO strategy.
The Overall Average Position: A Broad Brushstroke
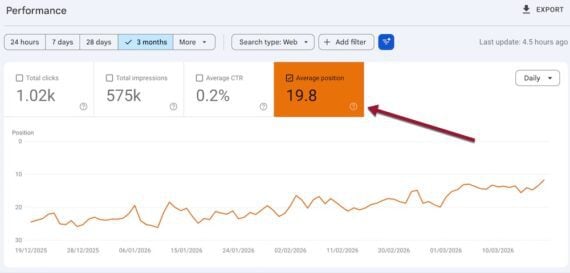
At the top of the Performance report, a single "Average position" figure aggregates the performance across all ranking queries for a given website. This overall average position is calculated by taking the sum of the positions of all your site’s ranking queries and dividing it by the total number of those queries. For instance, if your website ranks at position 5 for one query and position 15 for another, the overall average position would be 10 ((5+15)/2).
Google typically displays 10 organic listings per page. Therefore, an average position of 25, as commonly seen, suggests that, on average, your website’s content appears on the third page of Google search results for the queries it ranks for. The theoretical best ranking is position 1, representing the very top organic listing. While exceptionally poor rankings can extend beyond 100, the "overall average position" often provides limited actionable insight. This is primarily because it averages out high-performing queries with low-performing ones, potentially masking significant opportunities or critical issues. Consequently, many SEO professionals recommend treating this aggregate figure with caution and focusing on more granular data for strategic decision-making.

Supporting Data: While specific aggregate data for all websites isn’t publicly disclosed by Google, industry analyses consistently show that the average position for many websites falls in the double digits. This underscores the competitive nature of organic search and the challenge of achieving top rankings across a broad spectrum of keywords. A study by Moz in 2023, for example, indicated that the average position for a first-page result is typically between 1 and 10, with pages beyond the top 10 experiencing significantly lower click-through rates.
The Query-Specific Average Position: Unveiling Granular Performance
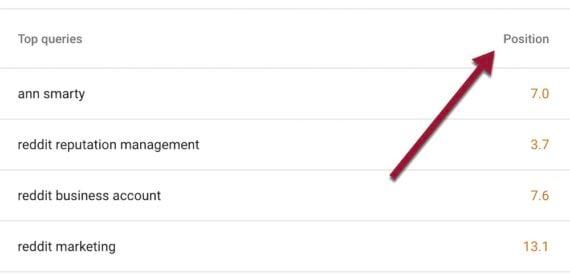
Scrolling down the Performance report reveals a table detailing the average position for each individual query. This metric is far more insightful as it represents the average ranking of a specific URL across all searchers for that particular term. For example, if two users search Google using the same keyword, and your website appears in position 1 for one user and position 2 for the other, Search Console will report an average query position of 1.5 for that keyword.
Crucially, Search Console only reports an average query position if a human or an AI bot has actually viewed and registered your website’s presence in the search results for that specific query. This means that a query for which you have no reported position might still be one for which you rank, but Google hasn’t been able to definitively assign a position based on its algorithms or user interaction data.
Timeline/Chronology: The introduction and evolution of Google Search Console (originally Google Webmaster Tools) have been gradual. The "Average position" metric has been a staple for years, providing users with a quantifiable measure of their ranking. However, its interpretation has become more complex with the advent of rich results, AI-driven summaries, and personalized search experiences, prompting the need for a deeper understanding of its components.
Deconstructing Ranking Positions in Modern SERPs
Google’s search results pages (SERPs) have evolved significantly from a simple list of 10 blue links. The inclusion of various special elements has a direct impact on how "average position" is calculated and perceived.
The Impact of Special Elements on Ranking
According to Google’s definitions, each organic result is assigned a position. However, this extends to special elements that appear on the SERP. This includes AI Overviews, image packs, video carousels, and "People also ask" (PAA) boxes. Each of these features occupies a "position" in the eyes of the algorithm and, consequently, influences the average position metric.
For instance, if a page ranks organically at position 1 for a specific query but does not appear in a prominent image pack that ranks at position 1, its average position might be calculated as 2. This is because the image pack itself is considered position 1, and the organic listing is effectively pushed down by its presence. Conversely, if a page appears in a top image pack (position 1) but its organic listing is at position 2, the average position would be 1.
Example Scenario (Giphy): Consider a search for "panda GIFs." A website like Giphy might appear at the very top of the image pack, which Google designates as position 1. However, its primary organic listing might appear lower down, perhaps at position 2. In this scenario, Search Console would reflect an average position of 1 for Giphy for that query, acknowledging its prominent placement in the image carousel. This highlights how special features can significantly elevate a website’s perceived ranking, even if its traditional organic link is not the absolute first result.
URLs Within Special Sections: A Unified Position
A key aspect to understand is that all URLs appearing within a specific special section share the same average position. For example, if a website’s content is cited in an AI Overview at the very top of the search results, all URLs contributing to that overview are assigned an average position of 1, irrespective of their specific order within the AI-generated summary. Similarly, all URLs within an image pack are considered to hold position 1.
Challenges in Verifying Position
There are instances where determining an exact position can be challenging for Search Console. This can occur when a URL is referenced in a less prominent part of a special feature, such as an AI Overview where it appears after other citations. Similarly, if a URL is mentioned within a "People also ask" box, and that box is only visible to a searcher after they actively click on a question, its position might be less straightforward to quantify definitively.
Furthermore, Search Console’s reported position for a URL can vary among different users for several reasons. These variations are inherent to the personalized and context-aware nature of modern search algorithms.
Analysis of Implications: The complex nature of SERP elements means that a high average position number (e.g., 15) might not necessarily indicate poor performance if the majority of those rankings are for queries where the website appears in valuable featured snippets or image packs. Conversely, a seemingly good average position (e.g., 5) might be misleading if those rankings are for low-volume, less relevant keywords.
Device-Specific Performance: A Critical Differentiator
A significant factor influencing search result ordering is the device used for the search. Google often presents different search results for mobile devices compared to desktop computers. This divergence can stem from various factors, including the exclusion of certain special sections on mobile browsers or the adaptation of layouts to smaller screens.
By default, Google Search Console’s Performance reports display data primarily from desktop searches. To gain a comprehensive understanding of your website’s visibility across all user segments, it is imperative to analyze mobile performance separately.
How to Access Mobile Performance Data:

- Navigate to the Performance report in Google Search Console.
- Click on the "Add filter" button.
- Select "Device" from the dropdown menu.
- Choose "Mobile" as the device type.
By applying this filter, you can isolate and examine the average positions and other performance metrics specifically for mobile searches. To obtain an aggregated view or compare average positions across all devices simultaneously, you can select the "Compare" option after applying the "Device" filter and then choose "All devices" alongside "Mobile" and "Desktop."
Supporting Data: Numerous studies have indicated a significant disparity in click-through rates (CTRs) between desktop and mobile devices. For instance, reports from Statista have shown that while desktop users might have higher CTRs for top positions, mobile devices are increasingly dominant in search volume. Therefore, understanding how your average position translates into actual traffic on each device type is crucial for optimizing user experience and conversion rates.
Analysis of Implications: A website might perform exceptionally well on desktop, securing top organic positions, but struggle to appear prominently on mobile. This could be due to a lack of mobile optimization, a design that doesn’t adapt well to smaller screens, or the absence of mobile-friendly rich results. Conversely, a site that ranks poorly on desktop but excels on mobile might indicate a strong mobile-first strategy or a focus on queries that are more frequently searched on handheld devices. Analyzing device-specific data allows for targeted improvements, ensuring that the website is accessible and visible to the widest possible audience.
Conclusion: Strategic Interpretation for SEO Success
While the "Average position" metric in Google Search Console can initially appear opaque, a deeper understanding of its components—overall aggregation versus query-specific data, the influence of special SERP elements, and device-specific variations—unlocks its true potential. By moving beyond the headline figure and delving into the granular details, marketers and website owners can gain invaluable insights into their organic search performance. This enables them to identify high-value keywords, understand where their content is truly resonating, and pinpoint areas requiring optimization. Ultimately, a strategic and nuanced interpretation of Search Console data is not just about understanding rankings; it’s about driving tangible improvements in organic visibility and achieving digital marketing objectives.
