
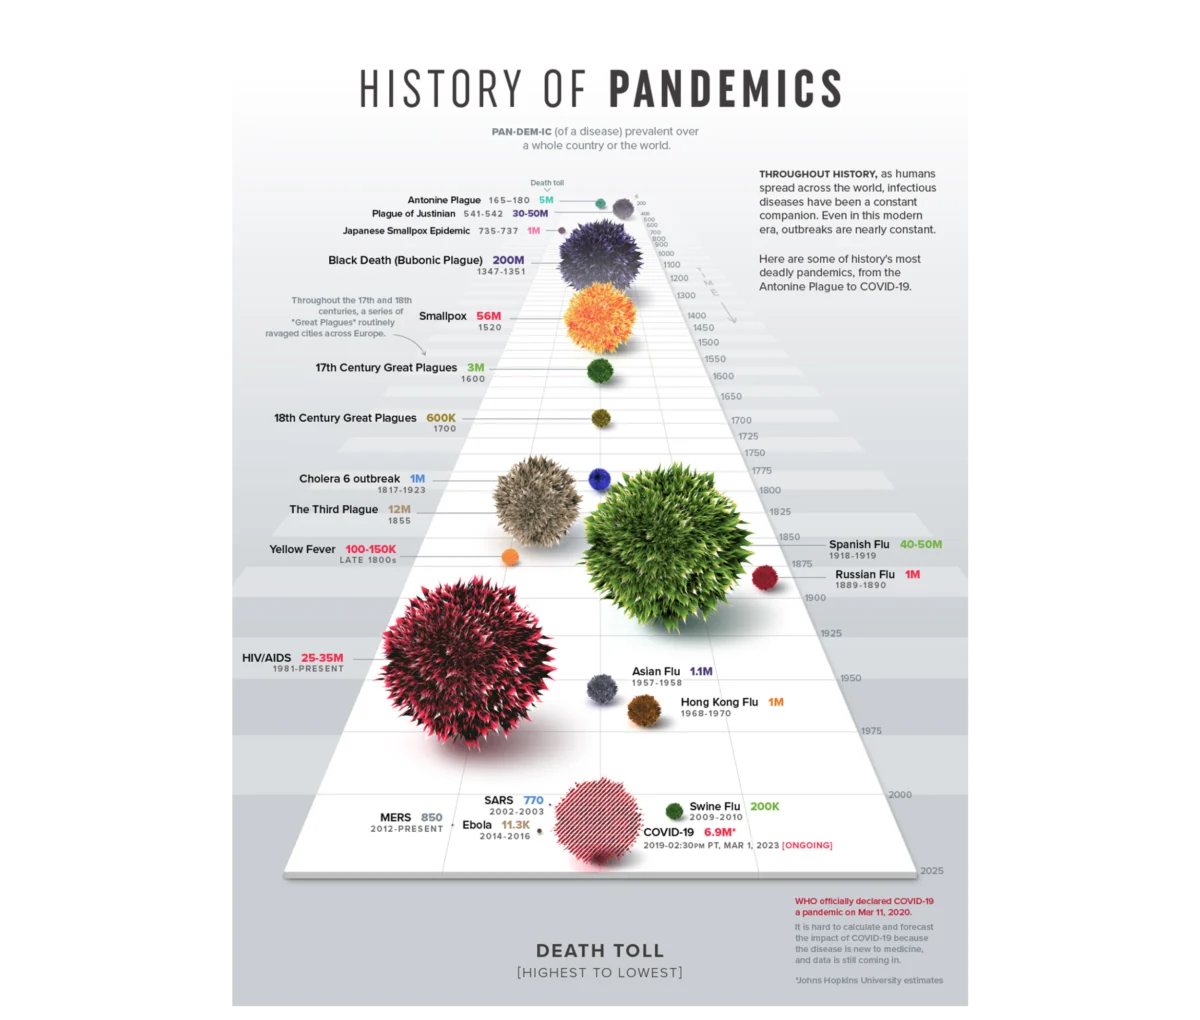
The modern corporate landscape is currently saturated with data, yet organizations frequently struggle to convert this surplus of information into meaningful operational outcomes. While the tools for generating dashboards and performance decks have become increasingly accessible, a persistent disconnect remains between technical accuracy and communicative efficacy. Industry experts, including design strategist Meriem Benhabiles, argue that the failure of most data presentations lies not in the quality of the underlying datasets, but in a fundamental lack of structured User Experience (UX) thinking. When data fails to produce a decision or a shift in thinking, it is often because the visualization was built around what was available rather than the specific questions requiring answers. By treating data visualization and UX as complementary disciplines, organizations can transform passive charts into functional decision-making engines.
The Historical Imperative: Beyond Raw Statistics
The necessity of visualization as a diagnostic and communicative tool was perhaps most famously illustrated in 1973 by the statistician Francis Anscombe. In his seminal paper, Anscombe presented four datasets—now known as Anscombe’s Quartet—that are statistically identical in terms of mean, variance, correlation coefficient, and regression line. However, when plotted on a graph, the four sets reveal drastically different patterns, ranging from linear relationships to extreme outliers and non-linear curves. Anscombe’s work demonstrated a foundational truth: raw numbers can conceal operational realities that only visualization can reveal.
Building upon this, Edward Tufte, a pioneer in the field of data design, codified the "data-ink ratio" in his 1983 book, The Visual Display of Quantitative Information. Tufte’s principle suggests that every mark on a chart should serve a specific data-driven purpose, advocating for the removal of "chartjunk" or non-informative decorative elements. While Tufte’s focus was on visual hygiene and clarity, modern data UX takes this a step further. Today’s designers recognize that a chart is never viewed in a vacuum; it is processed by a specific person, under specific professional pressures, within a specific organizational context. Consequently, the goal of modern visualization has shifted from mere simplicity to "appropriate complexity"—providing the exact level of detail required for a specific audience to take action.
The 80/20 Rule of Data Architecture
In the realm of high-impact dashboard design, approximately 80% of the work that determines success occurs before a single chart is rendered. This upstream architectural phase is defined by three critical pillars: Context, Audience, and Insight.
Defining Context: Moving from Metrics to Objectives
Most data projects suffer from an "inverse start," where teams pull existing metrics from analytics tools and attempt to build a narrative around them. This "data-first" approach often results in dashboards that are technically comprehensive but strategically aimless. A "context-first" approach, by contrast, begins with a constrained, answerable design problem.
For instance, a general request to "show product performance" lacks the specificity needed for effective design. A refined objective, such as "identifying which features drive retention among users who signed up in the first quarter," provides three essential components: a metric, a specific population, and an implied action. By filtering out the noise of irrelevant data, designers can create focused funnels or bottleneck analyses that point directly to necessary interventions.
Understanding the Audience: The Density Dial
Designing for an audience requires a nuanced understanding of two factors: data literacy (familiarity) and professional stakes (accountability). An analyst requires a high-density environment—often referred to as a "cockpit" view—to conduct diagnostic discovery and uncover hidden patterns in raw user flows. In this context, granular detail is a necessity for identifying underperforming variables.

Conversely, an executive or a Head of Sales requires a "compass" view—a highly synthesized translation of data optimized for rapid commercial decisions. For these users, excessive density creates cognitive friction. Tailoring a dashboard involves adjusting the "density dial" to match the specific brain in the room, ensuring the signal is never lost in the noise of unnecessary detail.
Architecting Insight: Information vs. Action
There is a common misconception that if a chart is clear, the insight will follow naturally. However, information is merely what the data shows; insight is the shift in understanding or the course correction that occurs as a result. A dashboard built for information might sound an alarm by showing a 15% drop in booking rates, often triggering a misplaced "fire drill" within a UX or engineering team. A dashboard built for insight, however, would map that drop against traffic sources, potentially revealing that the decline was caused by an influx of low-intent click traffic from a new marketing campaign, rather than a failure in the app’s checkout flow.
Case Study: Transforming Enterprise Talent Management
The practical application of these principles was recently evidenced in a project for a B2B SaaS platform specializing in enterprise talent management and competency tracking. The platform possessed an immense archive of user activity telemetry but lacked a coherent way to present this data to enterprise teams.
Strategic Design Choices
Rather than charting every available data point, the design team focused on "meaningful signals" such as competency scores, certification completion rates, and performance trajectories. While "time spent on platform" was an easy metric to track, it was relegated to a supporting signal, as it only indicated presence rather than actual proficiency.

To address the diverse needs of the users, the team developed two distinct narrative structures:
- The Individual Workspace: Designed for self-direction, this view acted as a personal mirror, allowing users to identify their own strengths and slipping metrics.
- The Managerial Interface: This view bypassed individual milestones to provide a macro pulse check on team vulnerabilities. It was designed to shift the manager’s workflow from reactive "post-mortems" to proactive guidance.
The Implementation of Mental Models
One of the most effective design choices in this project was the use of radar charts (also known as spider charts) to map multi-dimensional skill sets. By organizing eight distinct competency areas across axes radiating from a central point, the interface allowed users to grasp their professional profile at a single glance. A balanced polygon indicated well-rounded proficiency, while a skewed shape immediately highlighted critical vulnerabilities.
While a traditional bar chart would have required the user to mentally compare eight separate variables, the radial layout leveraged pre-attentive visual processing to make the data instantly readable. Furthermore, a consistent color system—integrated into the data model from the branding phase—ensured that users did not have to "re-learn" the dashboard’s language as they navigated between different products and filters.
Quantifiable Impact and Industry Implications
The shift from passive reporting to active insight tools has profound implications for organizational efficiency. In the case of the talent management platform, the deployment of personalized dashboards and side-by-side comparison tools led to a measurable increase in weekly active engagement with analytics features. Managers reported that the visual cues allowed them to intervene and support employees before skill gaps evolved into project failures.

Broader industry data supports this user-centric approach. According to research from McKinsey & Company, organizations that are "data-driven" are 23 times more likely to acquire customers and six times as likely to retain those customers. However, Gartner reports that through 2025, 80% of organizations seeking to scale digital business will fail because they do not take a modern approach to data and analytics governance, which includes the human-centric design of data interfaces.
The Future of Data UX: Proactive Guidance
As Artificial Intelligence and Machine Learning become more integrated into business intelligence tools, the role of the data designer will continue to evolve. The future of data visualization lies in "proactive guidance"—systems that not only show what happened but suggest what should happen next.
The transition from a "data graveyard" to a "strategic engine" requires a cultural shift within organizations. It demands that data design be treated as an upstream architectural choice rather than a downstream formatting step. When designers and analysts stop focusing on the charts and start focusing on the human decisions those charts are meant to support, data finally fulfills its promise as a driver of direction and change.
In conclusion, the efficacy of data visualization is not measured by the complexity of the tool or the size of the dataset, but by the clarity of the decision it facilitates. By applying structured UX thinking—defining context, understanding the audience, and architecting for insight—organizations can ensure that their data is not just seen, but understood and acted upon. The next generation of dashboards will not be passive logs of the past; they will be the blueprints for the future of the enterprise.

