
In the contemporary corporate landscape, the availability of data has reached a historical peak, yet the ability of organizations to translate that data into actionable decisions remains a persistent challenge. Despite the proliferation of sophisticated business intelligence (BI) tools and the presence of performance decks across every corporate function—from sales and product development to marketing and operations—a recurring phenomenon plagues weekly standups and quarterly reviews. Teams present technically accurate figures, stakeholders acknowledge the metrics, and meetings frequently conclude without a clear direction or a definitive decision. This disconnect highlights a fundamental friction at the intersection of data science and user experience (UX) design: dashboards are often built to be correct, but they are rarely designed to be communicative.
The core of the issue seldom resides in the data itself. While it is common to blame a lack of granularity or incomplete datasets for indecision, the reality is that many dashboards are constructed based on what data is available rather than the specific questions that require answers. Meriem Benhabiles, a specialist in the field, posits that data visualization and UX design are essentially solving the same underlying problem: the movement of the right information to the right person in a manner that facilitates change. When these two disciplines are treated as complementary, dashboards evolve from passive collections of charts into functional tools for organizational transformation.
The Diagnostic and Communicative Power of Visualization
The theoretical foundation for modern data visualization was significantly advanced in 1973 when statistician Francis Anscombe published a landmark paper introducing what is now known as Anscombe’s Quartet. He constructed four datasets that were statistically identical in terms of mean, variance, correlation coefficient, and regression line. However, when plotted on a graph, the four datasets revealed vastly different patterns—from linear relationships to outliers and non-linear curves. Anscombe’s lesson was clear: visualization reveals operational truths that raw numbers conceal.
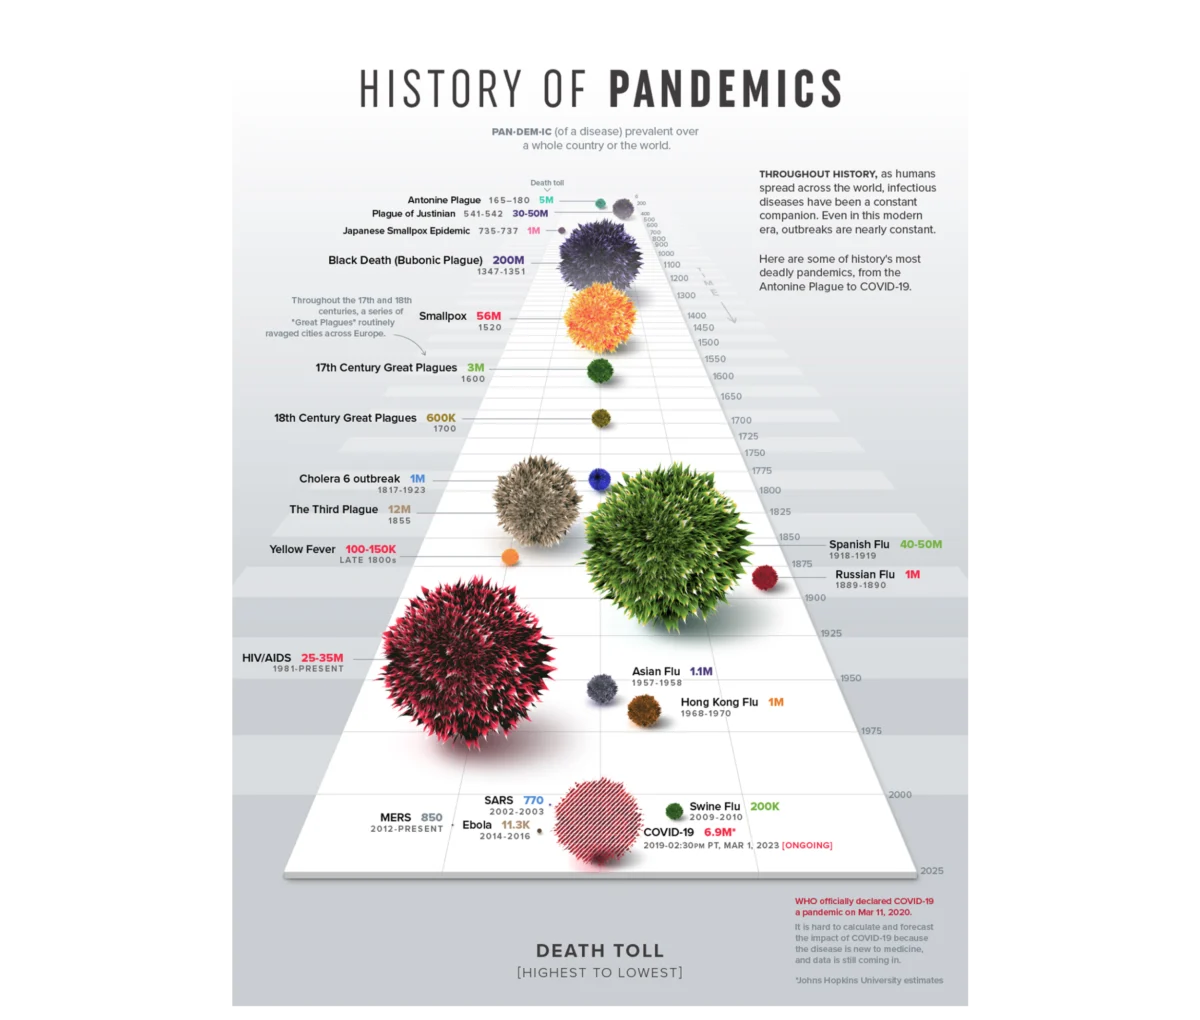
Beyond diagnosis, visualization serves a critical communicative function. The form chosen for data determines whether understanding emerges or is lost in visual noise. A notable contemporary example is Visual Capitalist’s "History of Pandemics" infographic. Rather than presenting a dense table of casualty counts, the designers utilized a proportional bubble layout on a single timeline. This allowed the human visual system to grasp the staggering scale of the Black Death relative to other historical events before a single label was even processed.
However, the pursuit of clarity often leads designers to follow Edward Tufte’s "data-ink ratio" principle, which suggests that every mark on a chart should serve the data rather than decorate it. While this is a foundational rule for visual hygiene, modern UX thinking suggests that simplicity is not always the ultimate goal. Instead, the focus should be on "appropriate complexity"—providing the exact layer of context a specific decision-maker needs to act.
The Evolution of Data Presentation: A Chronological Perspective
The journey from static reporting to UX-driven data storytelling has followed a distinct historical trajectory:
- The Statistical Foundation (1970s–1980s): Figures like Francis Anscombe and Edward Tufte established the mathematical and aesthetic rules for representing quantitative information. The focus was on accuracy and the elimination of "chart junk."
- The Rise of Business Intelligence (1990s–2000s): The advent of digital spreadsheets and early BI software allowed for the mass production of dashboards. However, this era was characterized by "data dumping," where every available metric was squeezed into a single view.
- The Accessibility Explosion (2010s): Tools like Tableau, Power BI, and Google Looker Studio democratized data visualization. While this made chart-making easier, it also led to a surplus of technically correct but "communicatively inert" dashboards.
- The UX Integration Era (2020s–Present): Organizations are beginning to realize that data is a message. The current trend involves applying structured UX frameworks—user research, persona mapping, and journey tracking—to the creation of data products.
The 80% Framework: Strategic Preparation Before Design
A successful dashboard is determined by the work performed before a single chart is drawn. Industry experts suggest that 80% of a dashboard’s effectiveness stems from three upstream questions regarding context, audience, and insight.

Defining Context and Operational Goals
Most data projects start in reverse, anchoring on existing metrics rather than the problem at hand. A goal such as "show how the product is performing" is too vague to be useful. A functional goal must include a specific metric, a defined population, and an implied action—for example, "identifying which features drive retention among users who signed up in the first quarter." By starting with a constraint, designers can filter out 90% of the noise, ensuring that every element on the screen serves a purpose.
Understanding the Audience: Accountability and Familiarity
Designing for an audience requires an assessment of their data literacy (familiarity) and their professional stakes (accountability). An analyst requires a high-density environment to conduct diagnostic discovery, mapping raw user flows to uncover hidden patterns. Conversely, an executive needs a highly synthesized overview to make rapid budget or strategy decisions. Tailoring the "density dial" of the dashboard ensures the signal reaches the intended recipient without causing cognitive overload.
Driving Insight Over Information
Information is a report of what happened; insight is a determination of what should happen next. A dashboard built for information might show a 15% drop in conversion, leading to organizational panic. A dashboard built for insight would map that drop against traffic sources, revealing that the decline is due to a surge in low-intent traffic from a specific marketing campaign rather than a failure of the product itself. This distinction prevents costly "fire drills" and directs resources toward the actual problem.
Case Study: Talent Management and Competency Tracking
The practical application of these principles was demonstrated in a recent project for a B2B SaaS platform focused on enterprise talent management. The platform held a massive archive of user activity, but the client struggled to present this data to enterprise teams in a meaningful way.

The design team moved beyond the initial brief of "presenting user activity" and instead focused on the mechanics of performance. They identified that while "time spent" was a common metric, it was merely a proxy for engagement. The more meaningful signals were competency scores and historical performance trajectories.
To solve the problem of multi-dimensional analysis, the team utilized radar charts (also known as spider charts). By organizing eight distinct competency areas across axes radiating from a central point, the interface allowed users to see their "skill shape" at a glance. A balanced polygon indicated a well-rounded professional, while a skewed shape immediately highlighted a critical gap.
Furthermore, the team designed distinct interfaces for different personas. Individual contributors received a "self-directed mirror" to track their own growth, while managers were provided with a macro pulse check to identify team vulnerabilities. This shift from passive logging to active guidance resulted in a noticeable increase in weekly engagement and a reduction in platform churn.
Industry Implications and the Future of Data UX
The shift toward UX-driven data visualization has significant implications for the broader business world. According to various industry analyses, the "failure rate" of big data projects often exceeds 60%, frequently cited as a result of poor communication and lack of alignment with business objectives.

Market Reactions and Expert Analysis:
Industry analysts suggest that as artificial intelligence and automated reporting become more prevalent, the human element of "data storytelling" will become a premium skill. Automated systems can generate charts, but they cannot yet understand the nuances of organizational politics, specific industry pressures, or the emotional weight of a declining metric on a department head.
Supporting Data on Business Impact:
- Engagement: Organizations that implement user-centric dashboards report up to a 40% increase in data tool adoption among non-technical staff.
- Efficiency: Diagnostic time—the time it takes to identify the root cause of a metric change—is reduced significantly when dashboards are designed with "insight-first" frameworks.
- Retention: In the B2B SaaS sector, providing customers with clear, actionable analytics is increasingly cited as a top three factor in contract renewal.
Conclusion
Data design reaches its full potential when it is treated as an upstream architectural choice rather than a downstream formatting step. The transition from a "data-first" to a "human-first" approach ensures that dashboards are not merely archives of the past, but engines for the future. By focusing on context, audience, and insight, organizations can bridge the gap between having data and actually using it. As the volume of global data continues to expand, the ability to design for clarity and action will remain the defining factor in strategic success. The next generation of successful leaders will not be those with the most data, but those who can most effectively translate that data into a shared understanding of the path forward.

