

Google Search Console stands as an indispensable tool for website owners and digital marketers aiming to gauge and enhance their organic search performance. However, the intricacies of its Performance reports, particularly the "Average position" metric, often present a significant hurdle for busy executives who may not possess deep SEO expertise. This article aims to demystify this crucial metric, providing a clear understanding of its nuances and how it can be leveraged for strategic decision-making.
The Overarching Average Position: A Broad Stroke of Limited Insight
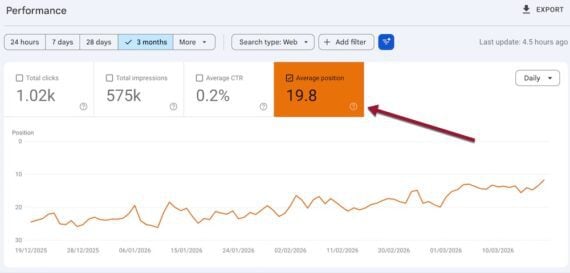
A common query directed at SEO professionals is, "Why is my average position so low?" This question typically refers to the aggregated "Average position" displayed prominently at the top of the Google Search Console Performance report. This figure represents the overall average ranking of a website across all search queries for which it has appeared in search results. In the standard Google search landscape, which typically displays ten organic listings per page, an average position of 25, for instance, indicates that, on average, the website’s content appears on the third page of search results.
While the theoretical best ranking is position 1, and exceptionally poor performance might be observed at position 100, the "Overall Average Position" metric is widely considered to offer limited actionable insight. Its aggregation across a vast spectrum of queries, encompassing both high-volume, competitive terms and obscure, long-tail keywords, dilutes its significance. For this reason, seasoned SEO practitioners often advise overlooking this overarching figure in favor of more granular analyses. The sheer breadth of data compressed into this single number makes it difficult to pinpoint specific areas for improvement or to understand the performance drivers behind it. It’s akin to looking at a company’s overall revenue without segmenting it by product line or region – the big picture is there, but the operational details are obscured.

Delving Deeper: The Query-Specific Average Position
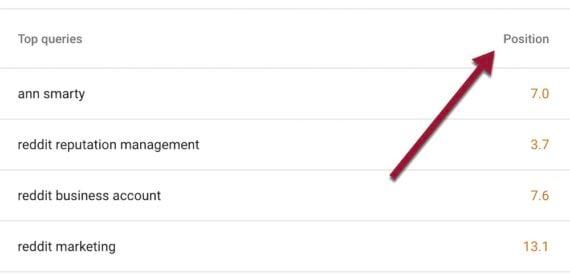
To gain a more meaningful understanding of organic search performance, it is essential to scroll down the Performance report to the section detailing the average position for each individual query. This metric provides a more refined view, representing the average position of a specific URL across all instances where users searched for that particular term.
For example, if two users search Google using the same keyword, and a particular URL ranks in position 1 for one user and position 2 for the other, Google Search Console will report an average query position of 1.5 for that keyword. This granular data is crucial because it allows for the identification of specific keywords that are performing well or underperforming. It also highlights opportunities to optimize content for terms that are close to achieving a top ranking.
It is important to note that Google Search Console only reports an average query position if a human or an AI bot has actually viewed the search result. This means that impression data, where a URL appears in search results but is not clicked, does not contribute to the average position calculation. This emphasizes the importance of not only ranking well but also being visible and engaging enough to be clicked.
The Nuances of Ranking: Beyond Simple Organic Listings
Google’s search results pages (SERPs) are increasingly complex, featuring a variety of elements beyond traditional organic listings. According to Google’s guidelines, each organic search result counts as one position. However, this also extends to special elements such as AI Overviews, image packs, video carousels, and "People also ask" (PAA) boxes. These rich results can significantly influence a user’s perception of a page’s ranking and its overall prominence.
Conversely, certain sections within the SERP do not occupy a position. These include search result sections that lack external links, such as certain informational panels or ads. This distinction is vital for understanding how a page’s average position is calculated. For instance, if a page ranks organically in position 1 for all searches related to a specific term but does not appear in a top-ranking image pack, its reported average position might be 2. This is because the image pack itself occupies the first "position" in the user’s view, even though the traditional organic listing follows.
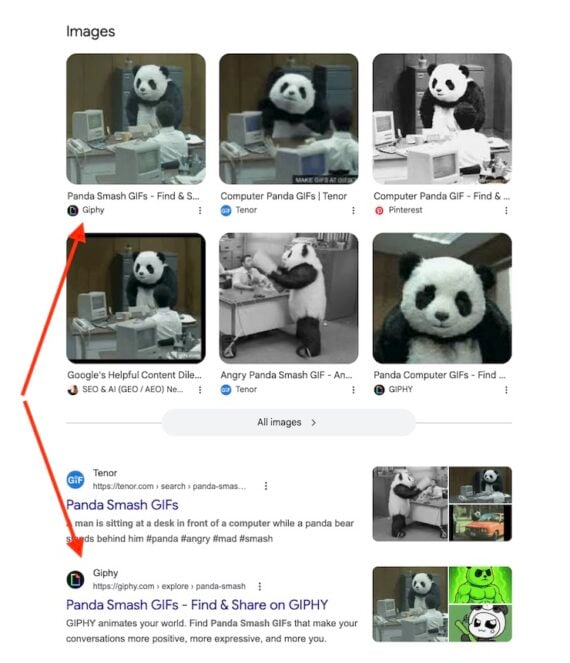
Conversely, if a page appears in a prominent image pack (position 1) but its organic listing is at position 2, its average position would be calculated as 1. This scenario was illustrated by a case study involving Giphy, where their content occupied a top image pack, resulting in an average position of 1, despite their organic listing appearing further down. This highlights the multifaceted nature of search result visibility and how different SERP features contribute to a page’s perceived ranking.
Understanding Special Sections and Their Impact on Average Position
All URLs featured within a specific "special section" of the search results page are assigned the same average position. For example, if an image pack is displayed at the very top of the SERP, all the URLs within that image pack will be considered to have an average position of 1. Similarly, any URL cited in an AI Overview prominently displayed at the top of the search results will also receive an average position of 1. This aggregation within special sections means that the performance of a single URL can be influenced by its inclusion in these prominent features.
Challenges in Verifying Position and Data Fluctuations
The exact position of a URL within the search results is not always straightforward to verify. For instance, a URL might be cited within an AI Overview but appear after other citations, making its specific ranking less obvious. Similarly, a URL might be included in a "People also ask" box, which only becomes visible to a searcher after they click on a question. These less direct appearances can complicate the precise determination of a URL’s position.
Furthermore, Google Search Console’s reported positions can vary among different users due to several factors. The search engine personalization algorithms continuously adapt to individual user behavior, search history, and location, leading to subtle differences in how search results are displayed. What one user sees at position 3 might appear at position 4 for another. This inherent variability underscores the importance of analyzing trends over time rather than focusing on single, static data points.
The Critical Role of Device Type in Search Performance
A significant factor influencing search result ordering is the device used for searching. Google often displays search results differently on mobile devices compared to desktop computers. This can include variations in the inclusion of special sections or the overall layout of the SERP. By default, Google Search Console displays performance data for desktop users.
To gain a comprehensive understanding of a website’s organic visibility, it is crucial to analyze performance across different devices. Users can access the mobile performance report by navigating to the "Add filter" option, selecting "Device," and then choosing "Mobile." For a comparative analysis that encompasses all devices, the "Compare" function can be utilized, allowing for the direct juxtaposition of average positions across desktop, mobile, and tablet. This segmented analysis is vital for identifying potential disparities in user experience and search performance based on device type, enabling targeted optimization strategies for each platform. For example, a website might perform exceptionally well on desktop but struggle to rank on mobile, indicating a need to prioritize mobile-first indexing and responsive design.
Implications for SEO Strategy and Executive Decision-Making
Understanding the nuances of Google Search Console’s "Average position" metric is not merely an academic exercise; it has direct implications for strategic SEO planning and executive decision-making. The distinction between the overall average position and the query-specific average position is paramount. While the former offers a very high-level, often misleading, overview, the latter provides the granular data necessary for identifying specific content and keyword opportunities.
For executives, this translates into a need to move beyond simplistic interpretations of performance data. Instead of asking "Why is our average position so low?", the more pertinent questions become: "Which keywords are driving our best rankings?", "Where are we losing ground on key terms?", and "How does our performance vary across different devices and search features?"
The evolution of Google’s SERPs, with the increasing prominence of AI Overviews, image packs, and PAA boxes, means that SEO success is no longer solely about traditional organic rankings. Websites that can effectively integrate their content into these special sections often achieve higher visibility and engagement, even if their traditional organic rank is not number one. This necessitates a broader understanding of what "ranking" truly means in the current search landscape.
Furthermore, the variability of search results based on user personalization and device type underscores the need for robust, data-driven analysis. Relying on a single snapshot of average position can be detrimental. Instead, businesses should leverage the historical data within Search Console to identify trends, track the impact of SEO efforts over time, and adapt their strategies accordingly.
In conclusion, while Google Search Console’s "Average position" metric can initially appear opaque, a deeper understanding of its various components – the overall aggregate versus the query-specific average, the impact of SERP features, and the influence of device type – empowers website owners to make informed decisions. By moving beyond superficial interpretations and embracing a more granular, analytical approach, businesses can unlock the true potential of their organic search visibility and drive meaningful results in the ever-evolving digital landscape. This detailed comprehension is crucial for any executive seeking to optimize their online presence and achieve sustainable growth in organic search.
